class: center middle main-title section-title-5 # The Grammar<br>of Graphics .class-info[ <figure> <img src="img/00/ggplot-logo.png" alt="ggplot" title="ggplot" width="15%"> </figure> ] --- layout: true class: title title-5 --- # Mapping data to aesthetics .pull-left.center[ <figure> <img src="img/01/gg-book.jpg" alt="Grammar of Graphics book" title="Grammar of Graphics book" width="55%"> </figure> ] .pull-right[ .box-inv-5.medium[Aesthetic] .box-5[Visual property of a graph] .box-5.sp-after[Position, shape, color, etc.] .box-inv-5.medium[Data] .box-5[A column in a dataset] ] --- layout: false class: title title-5 section-title-inv-5 # Your turn #1 .box-5.medium[Watch this video] .box-5.medium[andhs.co/rosling] .box-5[Make a list of all the variables shown in the graph<br>(think about columns in a dataset)] .box-5[Make a list of how those variables are shown in the graph<br>(think about the graph's aesthetics and geometries)] <div class="countdown" id="timer_5f1681ea" style="right:0;bottom:0;font-size:1.5em;" data-warnwhen="0"> <code class="countdown-time"><span class="countdown-digits minutes">05</span><span class="countdown-digits colon">:</span><span class="countdown-digits seconds">00</span></code> </div> --- class: bg-full background-image: url("img/01/rosling-tedx.jpg") ??? Source: [New York Times](https://www.nytimes.com/2017/02/09/world/europe/hans-rosling-dead-statistician.html) --- layout: true class: title title-5 --- # Mapping data to aesthetics <table> <tr> <th class="cell-left">Data</th> <th class="cell-left">Aesthetic</th> <th class="cell-left">Geometry</th> </tr> <tr> <td class="cell-left">Wealth (GDP/capita)</td> <td class="cell-left">Position (x-axis)</td> <td class="cell-left">Point</td> </tr> <tr> <td class="cell-left">Health (Life expectancy) </td> <td class="cell-left">Position (y-axis) </td> <td class="cell-left">Point</td> </tr> <tr> <td class="cell-left">Continent</td> <td class="cell-left">Color</td> <td class="cell-left">Point</td> </tr> <tr> <td class="cell-left">Population</td> <td class="cell-left">Size </td> <td class="cell-left">Point</td> </tr> <tr> <td class="cell-left">Year</td> <td class="cell-left">Time</td> <td class="cell-left">Animation </td> </tr> </table> --- # Mapping data to aesthetics <table> <tr> <th class="cell-left">Data</th> <th class="cell-left"><code class="remark-inline-code">aes()</code></th> <th class="cell-left"><code class="remark-inline-code">geom</code></th> </tr> <tr> <td class="cell-left">Wealth (GDP/capita)</td> <td class="cell-left"><code class="remark-inline-code">x</code></td> <td class="cell-left"><code class="remark-inline-code">geom_point()</code></td> </tr> <tr> <td class="cell-left">Health (Life expectancy) </td> <td class="cell-left"><code class="remark-inline-code">y</code></td> <td class="cell-left"><code class="remark-inline-code">geom_point()</code></td> </tr> <tr> <td class="cell-left">Continent</td> <td class="cell-left"><code class="remark-inline-code">color</code></td> <td class="cell-left"><code class="remark-inline-code">geom_point()</code></td> </tr> <tr> <td class="cell-left">Population</td> <td class="cell-left"><code class="remark-inline-code">size</code> </td> <td class="cell-left"><code class="remark-inline-code">geom_point()</code></td> </tr> <tr> <td class="cell-left">Year</td> <td class="cell-left"><code class="remark-inline-code">transition</code> </td> <td class="cell-left"><code class="remark-inline-code">transition_time()</code></td> </tr> </table> --- # `ggplot()` template <code class ='r hljs remark-code'>ggplot(data = <b><span style='background-color:#CBB5FF'>DATA</span></b>) +<br> <b><span style='background-color:#FFDFD1'>GEOM_FUNCTION</span></b>(mapping = aes(<b><span style='background-color:#FFD0CF'>AESTHETIC MAPPINGS</span></b>))</code> -- <code class ='r hljs remark-code'>ggplot(data = <b><span style='background-color:#CBB5FF'>gapminder_2007</span></b>) +<br> <b><span style='background-color:#FFDFD1'>geom_point</span></b>(mapping = aes(<b><span style='background-color:#FFD0CF'>x = gdpPercap</span></b>, <br> <b><span style='background-color:#FFD0CF'>y = lifeExp</span></b>,<br> <b><span style='background-color:#FFD0CF'>color = continent</span></b>, <br> <b><span style='background-color:#FFD0CF'>size = pop</span></b>)))</code> --- layout: false .box-5[This is a dataset named `gapminder_2007`:] .small[ <table> <thead> <tr> <th style="text-align:center;"> country </th> <th style="text-align:center;"> continent </th> <th style="text-align:center;"> gdpPercap </th> <th style="text-align:center;"> lifeExp </th> <th style="text-align:center;"> pop </th> </tr> </thead> <tbody> <tr> <td style="text-align:center;"> Afghanistan </td> <td style="text-align:center;"> Asia </td> <td style="text-align:center;"> 974.5803384 </td> <td style="text-align:center;"> 43.828 </td> <td style="text-align:center;"> 31889923 </td> </tr> <tr> <td style="text-align:center;"> Albania </td> <td style="text-align:center;"> Europe </td> <td style="text-align:center;"> 5937.029526 </td> <td style="text-align:center;"> 76.423 </td> <td style="text-align:center;"> 3600523 </td> </tr> <tr> <td style="text-align:center;"> … </td> <td style="text-align:center;"> … </td> <td style="text-align:center;"> … </td> <td style="text-align:center;"> … </td> <td style="text-align:center;"> … </td> </tr> </tbody> </table> ] -- <code class ='r hljs remark-code'>ggplot(data = <b><span style='background-color:#CBB5FF'>gapminder_2007</span></b>,<br> mapping = aes(<b><span style='background-color:#FFD0CF'>x = gdpPercap</span></b>, <b><span style='background-color:#FFD0CF'>y = lifeExp</span></b>,<br> <b><span style='background-color:#FFD0CF'>color = continent</span></b>, <b><span style='background-color:#FFD0CF'>size = pop</span></b>)) +<br> <b><span style='background-color:#FFDFD1'>geom_point</span></b>() +<br> scale_x_log10()</code> --- layout: true class: title title-5 --- # Health and wealth <img src="01_grammar-of-graphics_files/figure-html/show-basic-gapminder-1.png" width="100%" style="display: block; margin: auto;" /> --- # Aesthetics .pull-left-3[ .box-inv-5.small[`color` (discrete)] <img src="01_grammar-of-graphics_files/figure-html/aes-color-discrete-1.png" width="100%" style="display: block; margin: auto;" /> .box-inv-5.small[`color` (continuous)] <img src="01_grammar-of-graphics_files/figure-html/aes-color-continuous-1.png" width="100%" style="display: block; margin: auto;" /> ] .pull-middle-3[ .box-inv-5.small[`size`] <img src="01_grammar-of-graphics_files/figure-html/aes-size-1.png" width="100%" style="display: block; margin: auto;" /> .box-inv-5.small[`fill`] <img src="01_grammar-of-graphics_files/figure-html/aes-fill-1.png" width="100%" style="display: block; margin: auto;" /> ] .pull-right-3[ .box-inv-5.small[`shape`] <img src="01_grammar-of-graphics_files/figure-html/aes-shape-1.png" width="100%" style="display: block; margin: auto;" /> .box-inv-5.small[`alpha`] <img src="01_grammar-of-graphics_files/figure-html/aes-alpha-1.png" width="100%" style="display: block; margin: auto;" /> ] --- layout: false class: bg-90 background-image: url("img/01/lter_penguins.png") ??? Artwork by @allison_horst https://github.com/allisonhorst/palmerpenguins --- class: bg-90 background-image: url("img/01/culmen_depth.png") ??? Artwork by @allison_horst https://github.com/allisonhorst/palmerpenguins --- layout: false ```r ggplot(data = penguins) + geom_point(mapping = aes(x = flipper_length_mm, y = body_mass_g, color = species)) ``` <img src="01_grammar-of-graphics_files/figure-html/unnamed-chunk-2-1.png" width="60%" style="display: block; margin: auto;" /> --- class: title title-5 section-title-inv-5 # Your turn #2 .box-5[Add color, size, alpha, and shape aesthetics to your graph.] .box-5[Experiment!] .box-5[Do different things happen when you map aesthetics to discrete and continuous variables?] .box-5[What happens when you use more than one aesthetic?] --- class: title title-5 # How would you make this plot? <img src="01_grammar-of-graphics_files/figure-html/unnamed-chunk-3-1.png" width="70%" style="display: block; margin: auto;" /> --- .left-code[ ```r ggplot(penguins) + geom_point(aes(x = body_mass_g, y = bill_length_mm, color = species)) ``` ] .right-plot[ 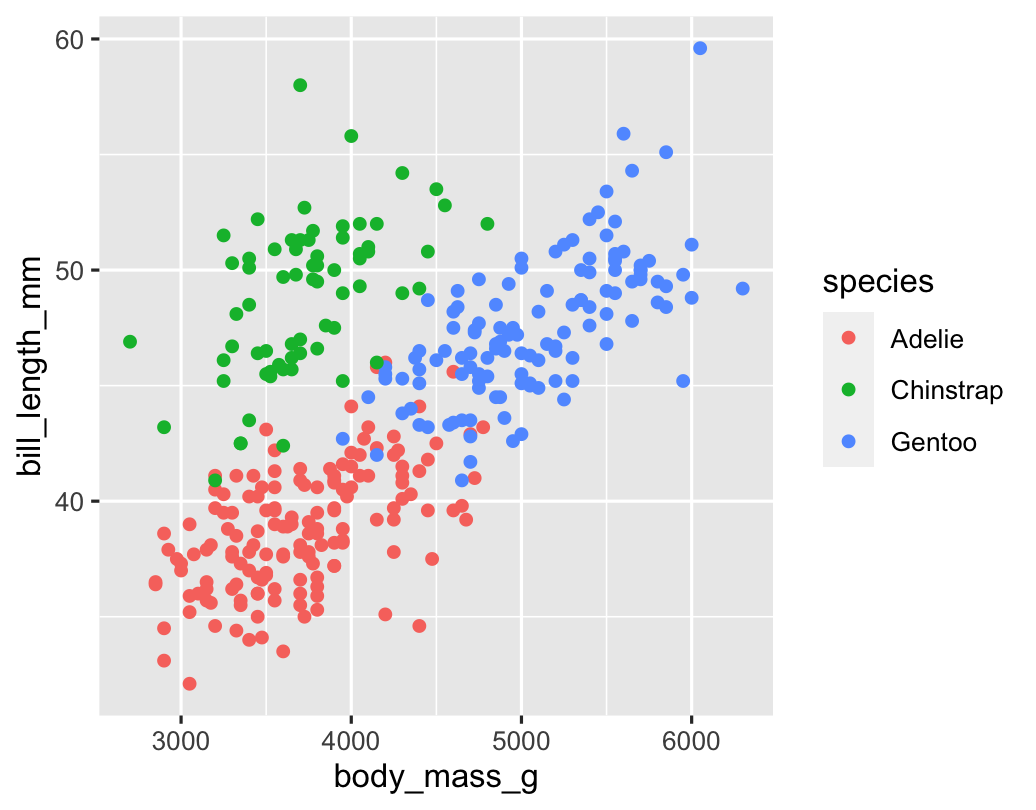 ] --- .left-code[ ```r ggplot(penguins) + geom_point(aes(x = body_mass_g, y = bill_length_mm), color = "blue") ``` ] .right-plot[ 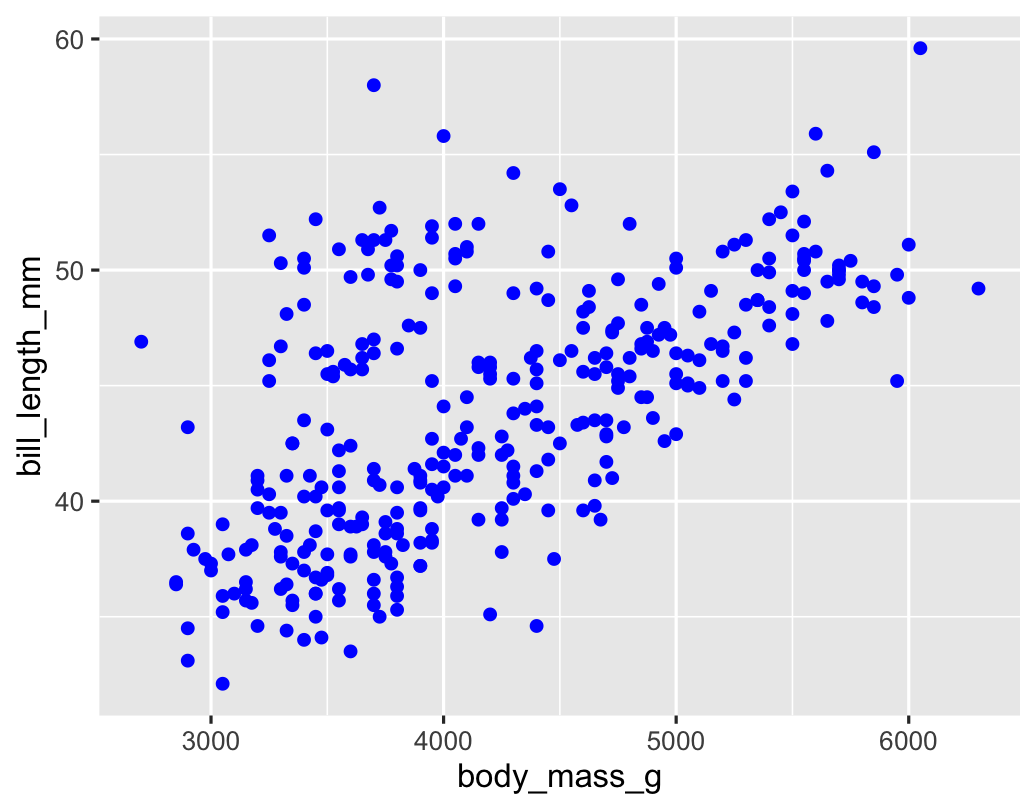 ] --- .pull-left[ .small[ ```r ggplot(penguins) + geom_point(aes(x = body_mass_g, y = bill_length_mm, color = "blue")) ``` <img src="01_grammar-of-graphics_files/figure-html/unnamed-chunk-4-1.png" width="100%" style="display: block; margin: auto;" /> ] ] .pull-right[ .small[ ```r ggplot(penguins) + geom_point(aes(x = body_mass_g, y = bill_length_mm), color = "blue") ``` <img src="01_grammar-of-graphics_files/figure-html/unnamed-chunk-5-1.png" width="100%" style="display: block; margin: auto;" /> ] ] --- layout: true class: title title-5 --- # Same aesthetics, different geoms .pull-left[ <img src="01_grammar-of-graphics_files/figure-html/unnamed-chunk-6-1.png" width="100%" style="display: block; margin: auto;" /> ] .pull-right[ <img src="01_grammar-of-graphics_files/figure-html/unnamed-chunk-7-1.png" width="100%" style="display: block; margin: auto;" /> ] --- # Geoms <code class ='r hljs remark-code'>ggplot(data = <b><span style='background-color:#CBB5FF'>DATA</span></b>) +<br> <b><span style='background-color:#FFDFD1'>GEOM_FUNCTION</span></b>(mapping = aes(<b><span style='background-color:#FFD0CF'>AESTHETIC MAPPINGS</span></b>))</code> --- # Possible geoms <table> <tr> <th class="cell-left"></th> <th class="cell-left">Example geom</th> <th class="cell-left">What it makes</th> </tr> <tr> <td class="cell-left"><img src="img/01/geom_bar.png"></td> <td class="cell-left"><code class="remark-inline-code">geom_col()</code></td> <td class="cell-left">Bar charts</td> </tr> <tr> <td class="cell-left"><img src="img/01/geom_text.png"></td> <td class="cell-left"><code class="remark-inline-code">geom_text()</code></td> <td class="cell-left">Text</td> </tr> <tr> <td class="cell-left"><img src="img/01/geom_point.png"></td> <td class="cell-left"><code class="remark-inline-code">geom_point()</code></td> <td class="cell-left">Points</td> </tr> <tr> <td class="cell-left"><img src="img/01/geom_boxplot.png"></td> <td class="cell-left"><code class="remark-inline-code">geom_boxplot()</code> </td> <td class="cell-left">Boxplots</td> </tr> <tr> <td class="cell-left"><img src="img/01/geom_sf.png"></td> <td class="cell-left"><code class="remark-inline-code">geom_sf()</code></td> <td class="cell-left">Maps</td> </tr> </table> --- # Possible geoms .box-inv-5[There are dozens of possible geoms!] .box-5[See [the **ggplot2** documentation](https://ggplot2.tidyverse.org/reference/index.html#section-layer-geoms) for<br>complete examples of all the different geom layers] .box-5[Also see the ggplot cheatsheet] --- layout: false class: title title-5 section-title-inv-5 # Your turn #3 .box-5[Replace this scatterplot with boxplots. Use the cheatsheet.] .pull-left[ <img src="01_grammar-of-graphics_files/figure-html/unnamed-chunk-8-1.png" width="100%" style="display: block; margin: auto;" /> ] .pull-right[ <img src="01_grammar-of-graphics_files/figure-html/unnamed-chunk-9-1.png" width="100%" style="display: block; margin: auto;" /> ] <div class="countdown" id="timer_5f168129" style="right:0;bottom:0;" data-warnwhen="0"> <code class="countdown-time"><span class="countdown-digits minutes">03</span><span class="countdown-digits colon">:</span><span class="countdown-digits seconds">00</span></code> </div> --- class: section-title-inv-5 .left-code[ ```r ggplot(penguins) + geom_boxplot(aes(x = species, y = body_mass_g)) ``` ] .right-plot[ 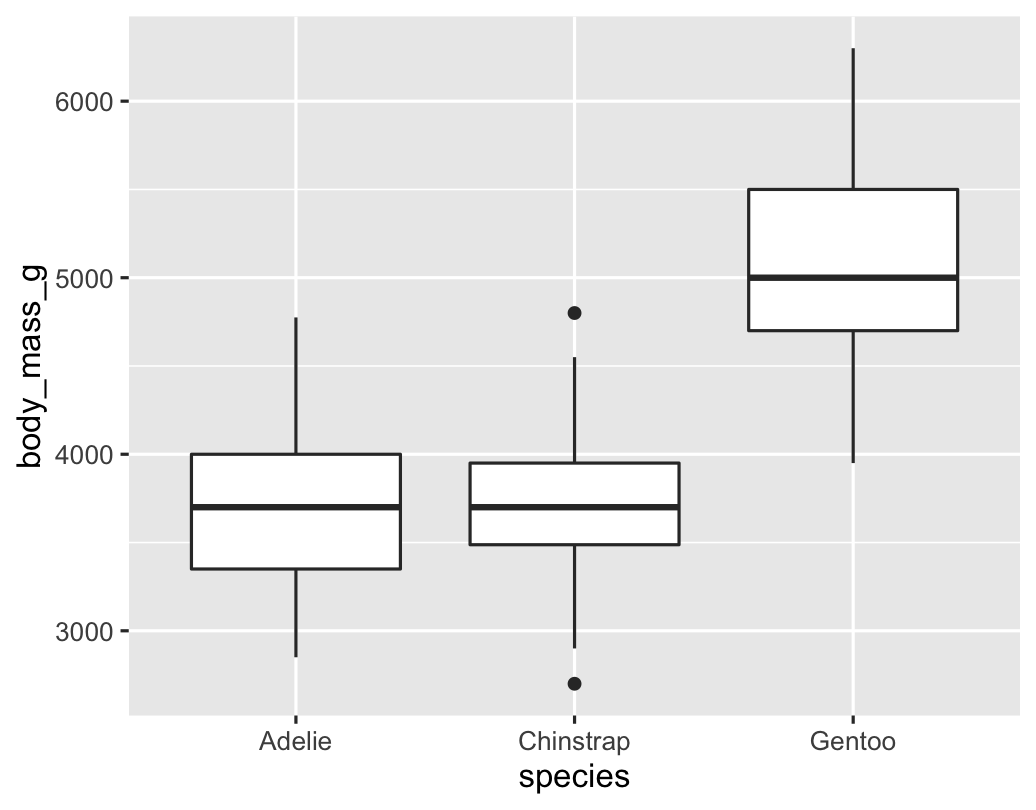 ] --- class: title title-5 section-title-inv-5 # Your turn #4 .box-5[Make a histogram of `bill_length_mm`. Use the cheetsheet.<br>Hint: don't supply a `y` variable.] <img src="01_grammar-of-graphics_files/figure-html/unnamed-chunk-11-1.png" width="70%" style="display: block; margin: auto;" /> <div class="countdown" id="timer_5f168103" style="right:0;bottom:0;" data-warnwhen="0"> <code class="countdown-time"><span class="countdown-digits minutes">03</span><span class="countdown-digits colon">:</span><span class="countdown-digits seconds">00</span></code> </div> --- class: section-title-inv-5 .left-code[ ```r ggplot(penguins) + geom_histogram(aes(x = bill_length_mm), binwidth = 1, color = "white") ``` ] .right-plot[ 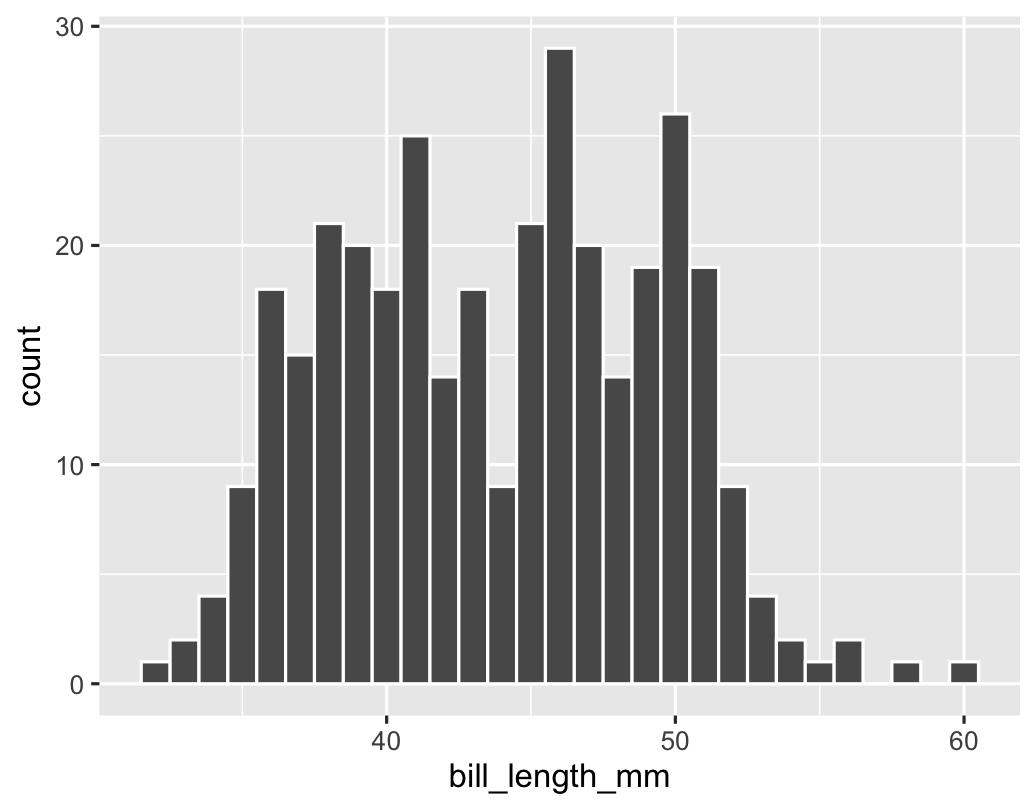 ] --- class: title title-5 section-title-inv-5 # Your turn #5 .box-5[Make this density plot of `bill_length_mm` filled by `species`.<br>Use the cheatsheet. Hint: don't supply a `y` variable.] <img src="01_grammar-of-graphics_files/figure-html/unnamed-chunk-13-1.png" width="70%" style="display: block; margin: auto;" /> <div class="countdown" id="timer_5f168425" style="right:0;bottom:0;" data-warnwhen="0"> <code class="countdown-time"><span class="countdown-digits minutes">03</span><span class="countdown-digits colon">:</span><span class="countdown-digits seconds">00</span></code> </div> --- class: section-title-inv-5 .left-code[ ```r ggplot(penguins) + geom_density(aes(x = bill_length_mm, fill = species), alpha = 0.75) ``` ] .right-plot[ 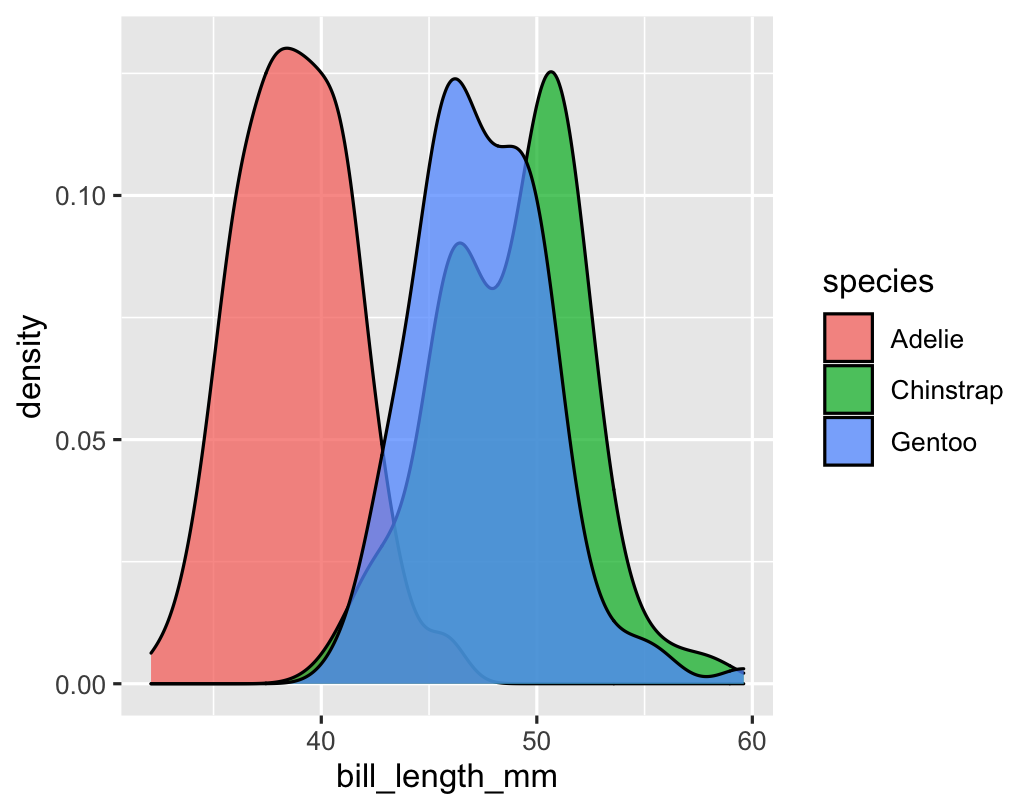 ] --- class: title title-5 # Complex graphs! <img src="01_grammar-of-graphics_files/figure-html/unnamed-chunk-15-1.png" width="70%" style="display: block; margin: auto;" /> --- class: title title-5 section-title-inv-5 # Your turn #6 .box-5[Predict what this code will do. Then run it.] ```r ggplot(data = penguins) + geom_point(mapping = aes(x = body_mass_g, y = bill_depth_mm, color = species)) + geom_smooth(mapping = aes(x = body_mass_g, y = bill_depth_mm, color = species)) ``` <div class="countdown" id="timer_5f168487" style="right:0;bottom:0;" data-warnwhen="0"> <code class="countdown-time"><span class="countdown-digits minutes">01</span><span class="countdown-digits colon">:</span><span class="countdown-digits seconds">00</span></code> </div> --- class: section-title-inv-5 .left-code[ ```r ggplot(data = penguins) + geom_point(aes(x = body_mass_g, y = bill_depth_mm, color = species)) + geom_smooth(aes(x = body_mass_g, y = bill_depth_mm, color = species)) ``` ] .right-plot[ 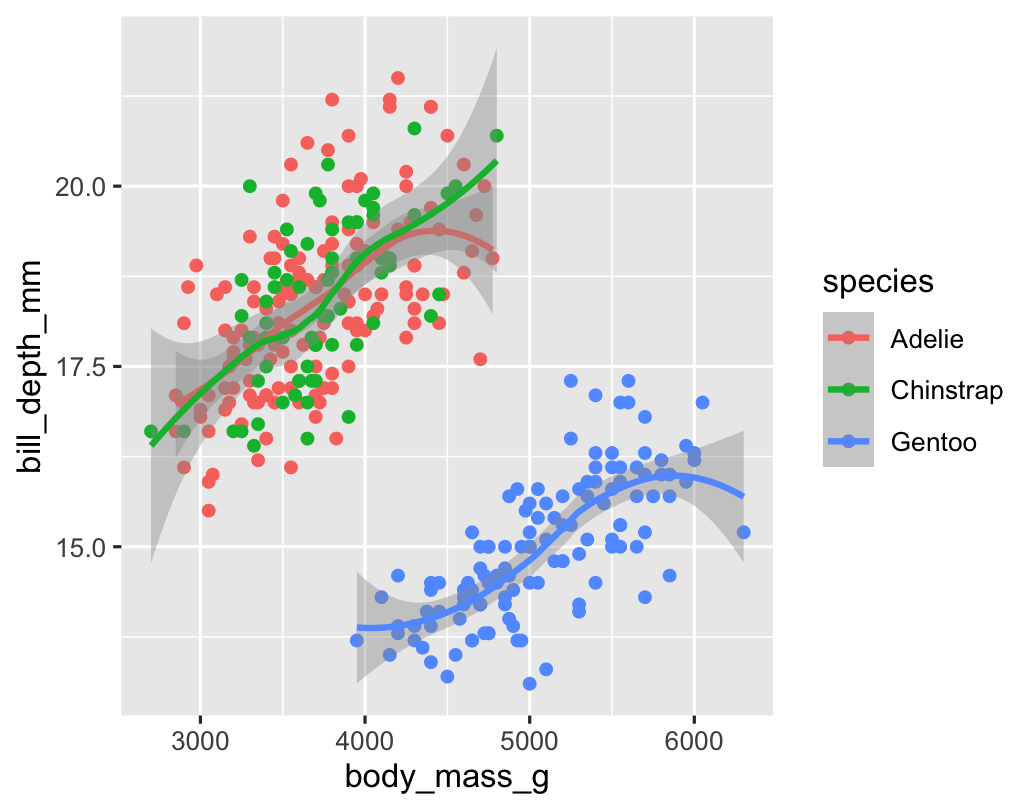 ] --- class: title title-5 # Global vs. local .box-inv-5[Any aesthetics in `ggplot()` will show up in all `geom_` layers] .small[ ```r ggplot(penguins, aes(x = body_mass_g, y = bill_depth_mm, color = species)) + geom_point() + geom_smooth() ``` <img src="01_grammar-of-graphics_files/figure-html/unnamed-chunk-18-1.png" width="60%" style="display: block; margin: auto;" /> ] --- class: title title-5 # Global vs. local .box-inv-5[Any aesthetics in `geom_` layers only apply to that layer] .small[ ```r ggplot(penguins, mapping = aes(x = body_mass_g, y = bill_depth_mm)) + geom_point(mapping = aes(color = species)) + geom_smooth(method = "lm") ``` <img src="01_grammar-of-graphics_files/figure-html/unnamed-chunk-19-1.png" width="60%" style="display: block; margin: auto;" /> ] --- layout: true class: title title-5 --- # Gammar components as layers .pull-left[ .box-inv-5[So far we know about data, aesthetics, and geometries] .box-inv-5[Think of these<br>components as **layers**] .box-inv-5[Add them to foundational `ggplot()` with `+`] ] .pull-right[  ] ??? Layer analogy borrowed from [Thomas Lin Pedersen](https://www.data-imaginist.com/) and his ["Drawing Anything with ggplot2" workshop](https://github.com/thomasp85/ggplot2_workshop). --- # Additional layers .pull-left[ .box-inv-5[There are many of other grammatical layers we can use to describe graphs!] .box-inv-5[We sequentially add layers onto the foundational `ggplot()` plot to create complex figures] ] .pull-right[ 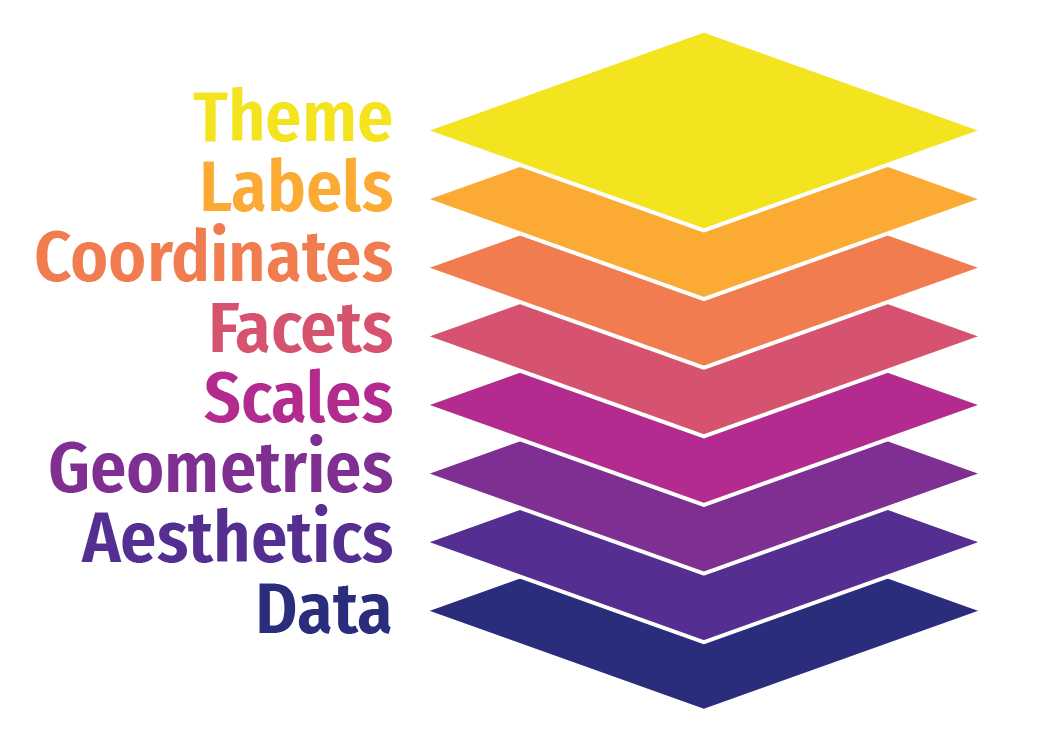 ] --- # Scales .box-inv-5[Scales change the properties of the variable mapping] <table> <tr> <th class="cell-left">Example layer</th> <th class="cell-left">What it does</th> </tr> <tr> <td class="cell-left"><code class="remark-inline-code">scale_x_continuous()</code></td> <td class="cell-left">Make the x-axis continuous</td> </tr> <tr> <td class="cell-left"><code class="remark-inline-code">scale_x_continuous(breaks = 1:5) </code></td> <td class="cell-left">Manually specify axis ticks</td> </tr> <tr> <td class="cell-left"><code class="remark-inline-code">scale_x_log10()</code></td> <td class="cell-left">Log the x-axis</td> </tr> <tr> <td class="cell-left"><code class="remark-inline-code">scale_color_gradient()</code></td> <td class="cell-left">Use a gradient</td> </tr> <tr> <td class="cell-left"><code class="remark-inline-code">scale_fill_viridis_d()</code></td> <td class="cell-left">Fill with discrete viridis colors</td> </tr> </table> --- # Scales .pull-left[ .box-inv-5.small[`scale_x_log10()`] <img src="01_grammar-of-graphics_files/figure-html/scale-example-1-1.png" width="100%" style="display: block; margin: auto;" /> ] -- .pull-right[ .box-inv-5.small[`scale_color_viridis_d()`] <img src="01_grammar-of-graphics_files/figure-html/scale-example-2-1.png" width="100%" style="display: block; margin: auto;" /> ] --- layout: false class: title title-5 section-title-inv-5 # Your turn #7 .box-5[Make this density plot of `bill_length_mm` filled by `species`.<br>Use the viridis fill scale.] .box-5.small[For bonus fun, try a different viridis option like `plasma` or `inferno`.] <img src="01_grammar-of-graphics_files/figure-html/unnamed-chunk-20-1.png" width="70%" style="display: block; margin: auto;" /> <div class="countdown" id="timer_5f16849f" style="right:0;bottom:0;" data-warnwhen="0"> <code class="countdown-time"><span class="countdown-digits minutes">03</span><span class="countdown-digits colon">:</span><span class="countdown-digits seconds">00</span></code> </div> --- class: section-title-inv-5 .left-code[ ```r ggplot(penguins, aes(x = bill_length_mm, fill = species)) + geom_density(alpha = 0.75) + scale_fill_viridis_d(option = "plasma") ``` ] .right-plot[ 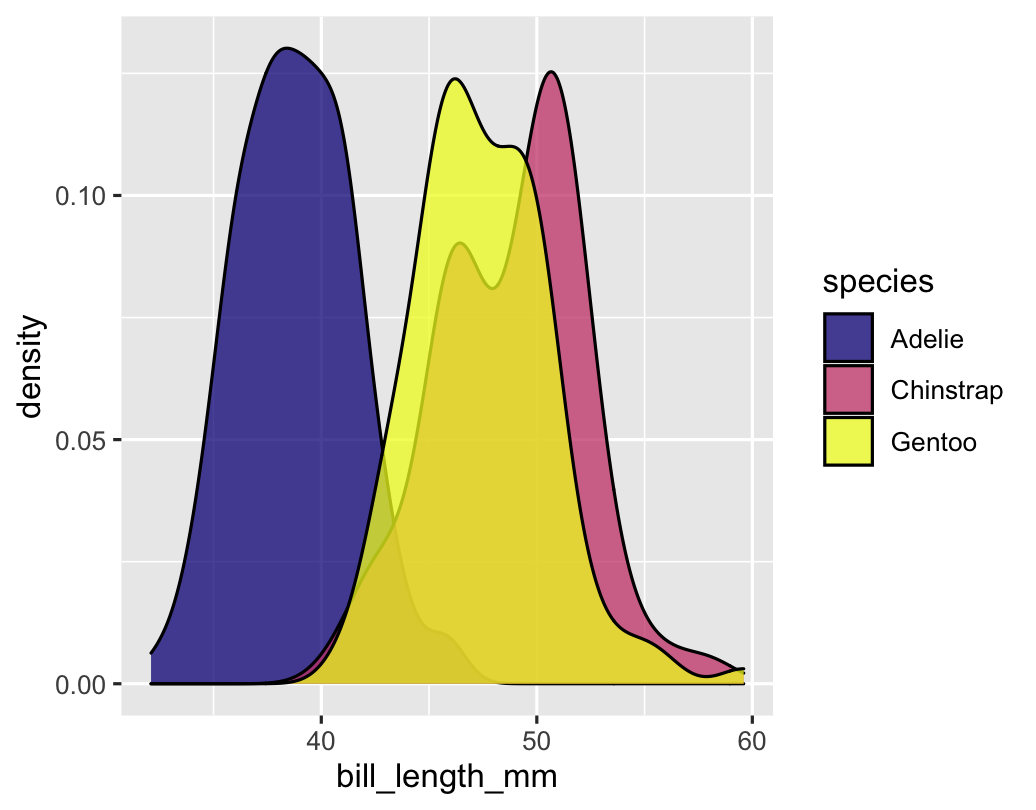 ] --- layout: true class: title title-5 --- # Facets .box-inv-5[Facets show subplots for different subsets of data] <table> <tr> <th class="cell-left">Example layer</th> <th class="cell-left">What it does</th> </tr> <tr> <td class="cell-left"><code class="remark-inline-code">facet_wrap(vars(continent))</code></td> <td class="cell-left">Plot for each continent</td> </tr> <tr> <td class="cell-left"><code class="remark-inline-code">facet_wrap(vars(continent, year))</code> </td> <td class="cell-left">Plot for each continent/year</td> </tr> <tr> <td class="cell-left"><code class="remark-inline-code">facet_wrap(..., ncol = 1)</code></td> <td class="cell-left">Put all facets in one column</td> </tr> <tr> <td class="cell-left"><code class="remark-inline-code">facet_wrap(..., nrow = 1)</code></td> <td class="cell-left">Put all facets in one row</td> </tr> </table> --- # Facets .pull-left[ .box-inv-5.small[`facet_wrap(vars(continent))`] <img src="01_grammar-of-graphics_files/figure-html/facet-example-1-1.png" width="100%" style="display: block; margin: auto;" /> ] -- .pull-right[ .box-inv-5.small[`facet_wrap(vars(continent, year))`] <img src="01_grammar-of-graphics_files/figure-html/facet-example-2-1.png" width="100%" style="display: block; margin: auto;" /> ] --- layout: false class: title title-5 section-title-inv-5 # Your turn #8 .box-5[Facet this scatterplot by `island`. Are there any interesting trends?] <img src="01_grammar-of-graphics_files/figure-html/unnamed-chunk-22-1.png" width="70%" style="display: block; margin: auto;" /> <div class="countdown" id="timer_5f168200" style="right:0;bottom:0;" data-warnwhen="0"> <code class="countdown-time"><span class="countdown-digits minutes">03</span><span class="countdown-digits colon">:</span><span class="countdown-digits seconds">00</span></code> </div> --- class: section-title-inv-5 .left-code[ ```r ggplot(penguins, aes(x = body_mass_g, y = bill_length_mm, color = species)) + geom_point() + facet_wrap(vars(island)) ``` ] .right-plot[ 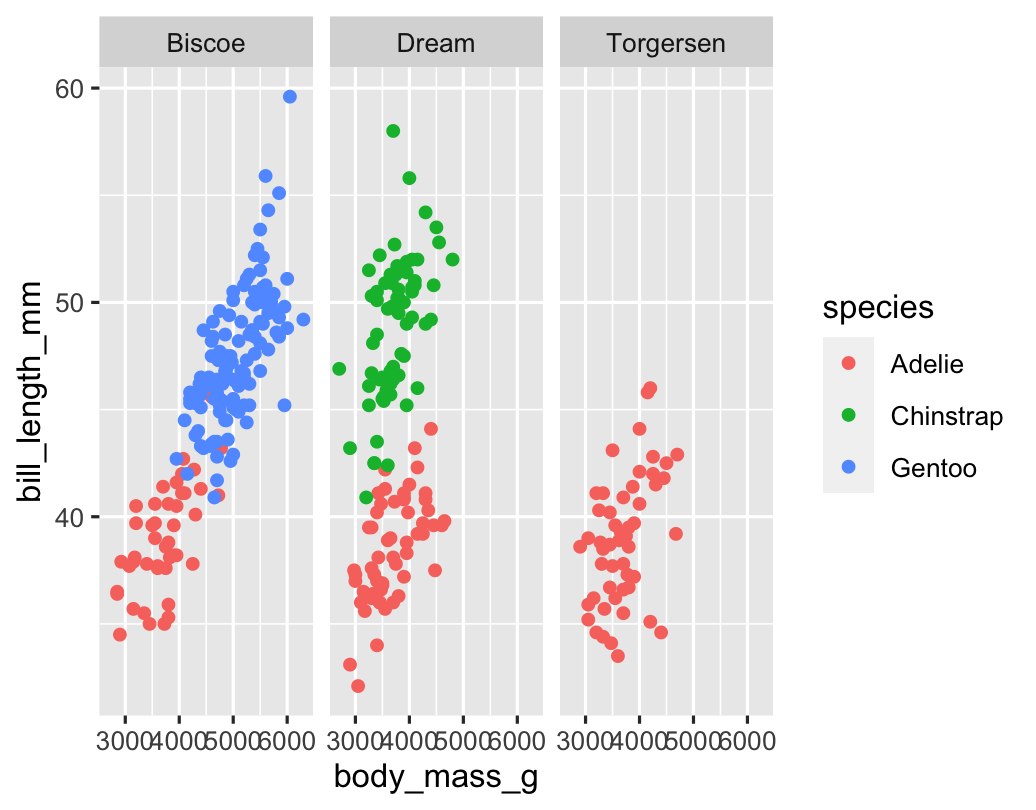 ] --- layout: true class: title title-5 --- # Coordinates .box-inv-5[Change the coordinate system] <table> <tr> <th class="cell-left">Example layer</th> <th class="cell-left">What it does</th> </tr> <tr> <td class="cell-left"><code class="remark-inline-code">coord_cartesian()</code></td> <td class="cell-left">Plot for each continent</td> </tr> <tr> <td class="cell-left"><code class="remark-inline-code">coord_cartesian(ylim = c(1, 10))</code> </td> <td class="cell-left">Zoom in where y is 1–10</td> </tr> <tr> <td class="cell-left"><code class="remark-inline-code">coord_flip()</code></td> <td class="cell-left">Switch x and y</td> </tr> <tr> <td class="cell-left"><code class="remark-inline-code">coord_polar()</code></td> <td class="cell-left">Use circular polar system</td> </tr> </table> --- # Coordinates .pull-left[ .box-inv-5.small[`coord_cartesian(ylim = c(70, 80), xlim = c(10000, 30000))`] <img src="01_grammar-of-graphics_files/figure-html/coord-example-1-1.png" width="100%" style="display: block; margin: auto;" /> ] -- .pull-right[ .box-inv-5.small[`coord_flip()`] <img src="01_grammar-of-graphics_files/figure-html/coord-example-2-1.png" width="100%" style="display: block; margin: auto;" /> ] --- # Labels .box-inv-5[Add labels to the plot with a single `labs()` layer] <table> <tr> <th class="cell-left">Example layer</th> <th class="cell-left">What it does</th> </tr> <tr> <td class="cell-left"><code class="remark-inline-code">labs(title = "Neat title")</code></td> <td class="cell-left">Title</td> </tr> <tr> <td class="cell-left"><code class="remark-inline-code">labs(caption = "Something")</td> <td class="cell-left">Caption</td> </tr> <tr> <td class="cell-left"><code class="remark-inline-code">labs(y = "Something")</td> <td class="cell-left">y-axis</td> </tr> <tr> <td class="cell-left"><code class="remark-inline-code">labs(size = "Population")</code></td> <td class="cell-left">Title of size legend</td> </tr> </table> --- # Labels .left-code[ ```r ggplot(gapminder_2007, aes(x = gdpPercap, y = lifeExp, color = continent, size = pop)) + geom_point() + scale_x_log10() + labs(title = "Health and wealth grow together", subtitle = "Data from 2007", x = "Wealth (GDP per capita)", y = "Health (life expectancy)", color = "Continent", size = "Population", caption = "Source: The Gapminder Project") ``` ] .right-plot[ 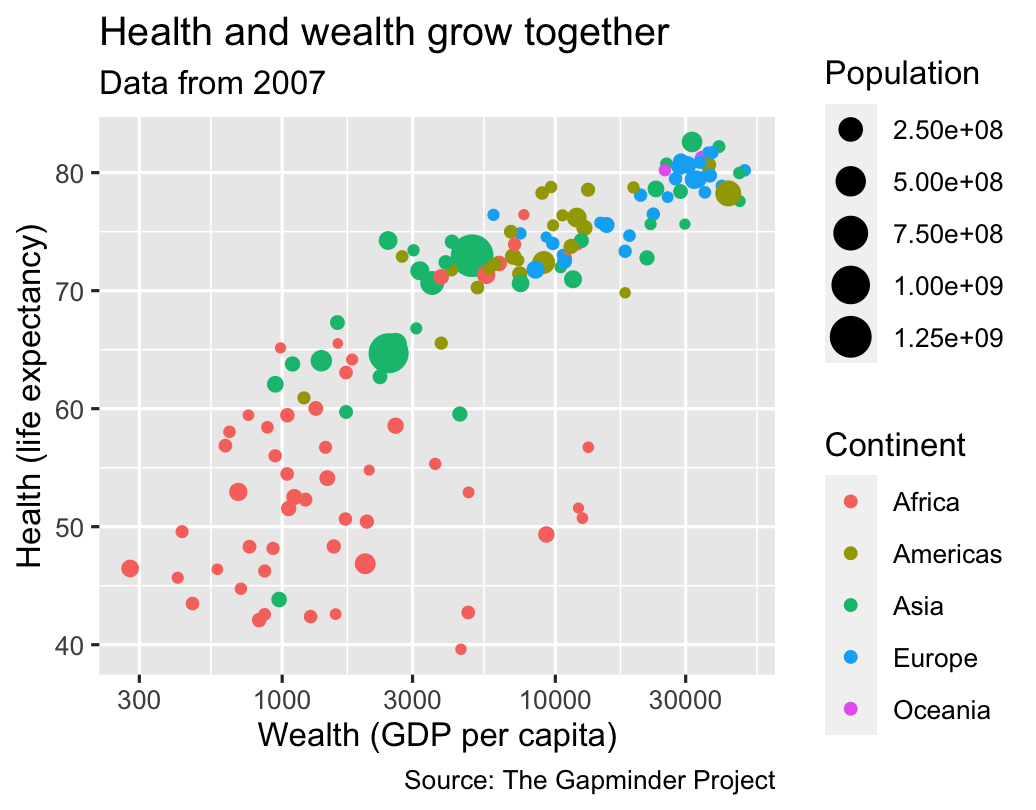 ] --- # Theme .box-inv-5[Change the appearance of anything in the plot] .box-5[There are many built-in themes] <table> <tr> <th class="cell-left">Example layer</th> <th class="cell-left">What it does</th> </tr> <tr> <td class="cell-left"><code class="remark-inline-code">theme_grey()</code></td> <td class="cell-left">Default grey background</td> </tr> <tr> <td class="cell-left"><code class="remark-inline-code">theme_bw()</td> <td class="cell-left">Black and white</td> </tr> <tr> <td class="cell-left"><code class="remark-inline-code">theme_dark()</td> <td class="cell-left">Dark</td> </tr> <tr> <td class="cell-left"><code class="remark-inline-code">theme_minimal()</code></td> <td class="cell-left">Minimal</td> </tr> </table> --- # Theme .pull-left[ .box-inv-5.small[`theme_dark()`] <img src="01_grammar-of-graphics_files/figure-html/theme-example-1-1.png" width="100%" style="display: block; margin: auto;" /> ] -- .pull-right[ .box-inv-5.small[`theme_minimal()`] <img src="01_grammar-of-graphics_files/figure-html/theme-example-2-1.png" width="100%" style="display: block; margin: auto;" /> ] --- # Theme .box-inv-5[There are collections of pre-built themes online,<br>like [the **ggthemes** package](https://jrnold.github.io/ggthemes/)] .center[ <figure> <img src="img/01/ggthemes.png" alt="ggthemes" title="ggthemes" width="45%"> </figure> ] --- # Theme .box-inv-5[Organizations often make their own custom themes, [like the BBC](https://bbc.github.io/rcookbook/)] .center[ <figure> <img src="img/01/bbc-cookbook.png" alt="ggthemes" title="ggthemes" width="80%"> </figure> ] --- # Theme options .box-inv-5[Make theme adjustments with `theme()`] .box-5[There are a billion options here!] ```r theme_bw() + theme(legend.position = "bottom", plot.title = element_text(face = "bold"), panel.grid = element_blank(), axis.title.y = element_text(face = "italic")) ``` --- # Saving graphs .box-inv-5.medium[Use `ggsave()` to save a plot to your computer] .box-5[Store plot as an object, feed it to `ggsave()`] ```r my_plot <- ggplot(...) ggsave("plot_name.pdf", my_plot, width = 5, height = 3.5) ggsave("plot_name.png", my_plot, width = 5, height = 3.5) ``` --- # So many possibilities! .pull-left[  ] .pull-right[ .box-inv-5[These were just a few examples of layers!] .box-5[See [the **ggplot2** documentation](https://ggplot2.tidyverse.org/reference/index.html) for<br>complete examples of everything you can do] ] --- # A true grammar .pull-left[ .box-inv-5[With the grammar of graphics, we don't talk about specific chart *types*] .box-5.small[Hunt through Excel menus for a stacked bar chart and manually reshape your data to work with it] ] .pull-right[ .center[ <figure> <img src="img/01/excel-chart-types.png" alt="Excel chart types" title="Excel chart types" width="78%"> </figure> ] ] --- # A true grammar .pull-left[ .box-inv-5[With the grammar of graphics, we *do* talk about specific chart *elements*] .box-5.small[Map a column to the x-axis, fill by a different variable, and `geom_col()` to get stacked bars] .box-5.small[Geoms can be interchangable<br>(e.g. switch `geom_violin()` to `geom_boxplot()`)] ] .pull-right[ .center[ <figure> <img src="img/01/ggplot-layers@4x.png" alt="Grammar of graphics layers" title="Grammar of graphics layers" width="100%"> </figure> ] ] --- # Describing graphs with the grammar .left-code[ .box-5.small[Map wealth to the x-axis, health to the y-axis, add points, color by continent, size by population, scale the y-axis with a log, and facet by year] ```r ggplot(filter(gapminder, year %in% c(2002, 2007)), aes(x = gdpPercap, y = lifeExp, color = continent, size = pop)) + geom_point() + scale_x_log10() + facet_wrap(vars(year), ncol = 1) ``` ] .right-plot[ 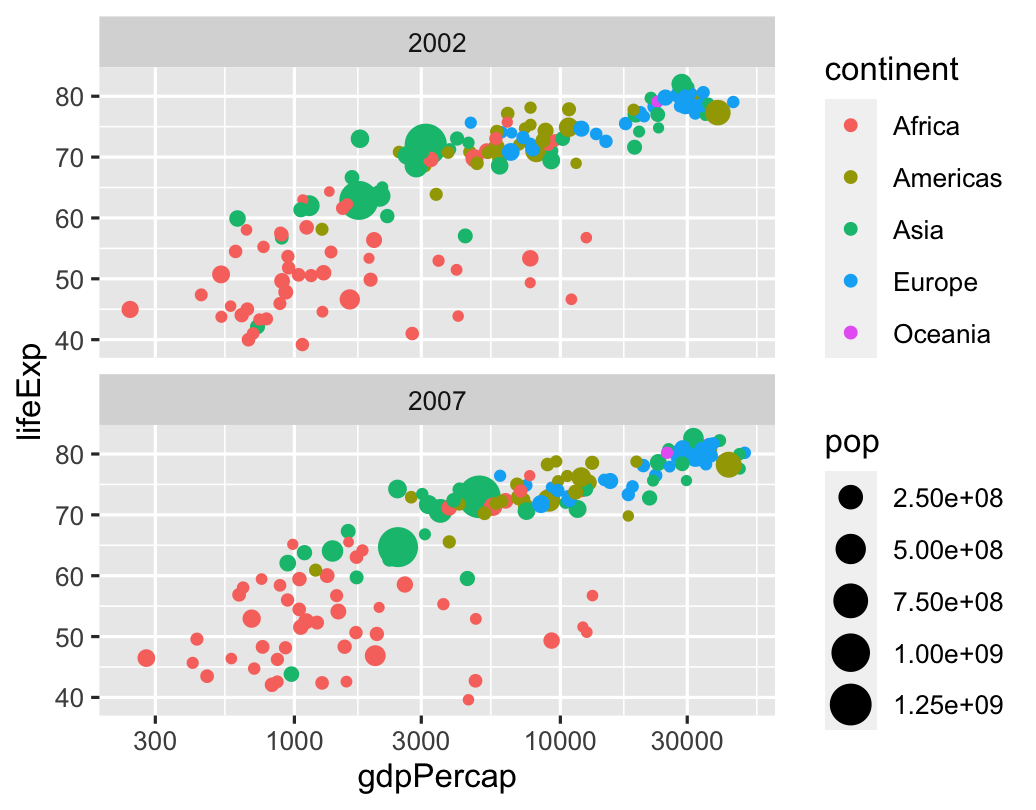 ] --- # Describing graphs with the grammar .left-code[ .box-5.small[Map health to the x-axis, add a histogram with bins for every 5 years, fill and facet by continent] ```r ggplot(gapminder_2007, aes(x = lifeExp, fill = continent)) + geom_histogram(binwidth = 5, color = "white") + guides(fill = FALSE) + # Turn off legend facet_wrap(vars(continent)) ``` ] .right-plot[ 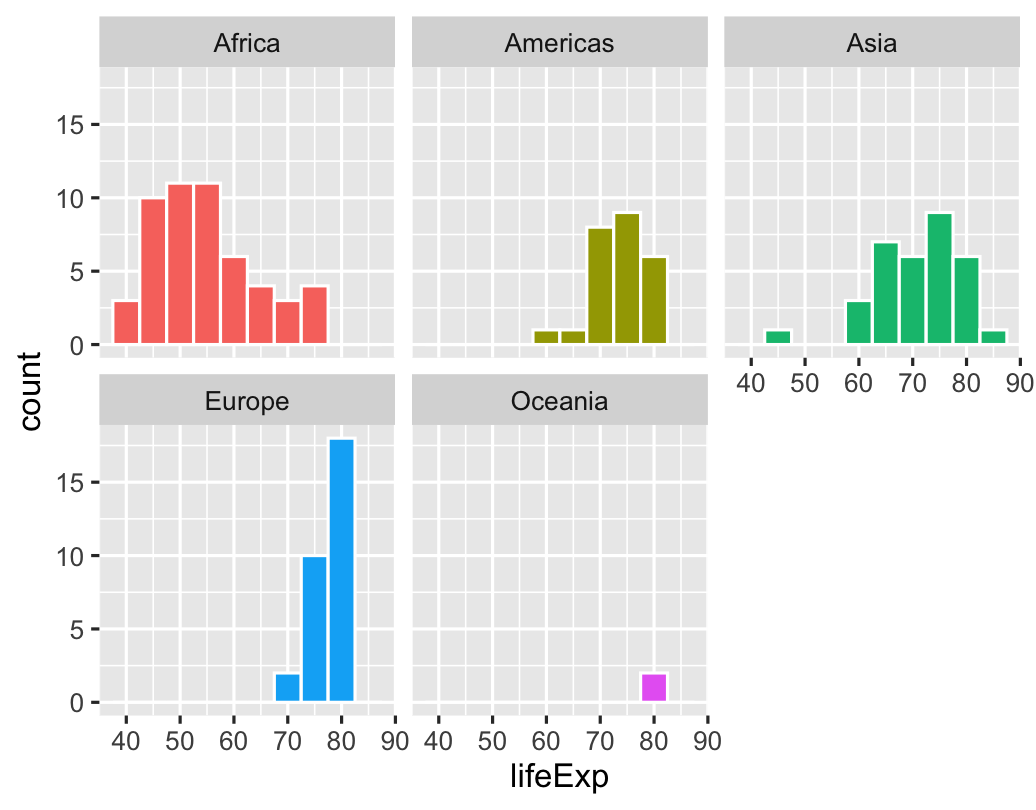 ] --- # Describing graphs with the grammar .left-code[ .box-5.small[Map continent to the x-axis, health to the y-axis, add violin plots and semi-transparent boxplots, fill by continent] ```r ggplot(gapminder, aes(x = continent, y = lifeExp, fill = continent)) + geom_violin() + geom_boxplot(alpha = 0.5) + guides(fill = FALSE) # Turn off legend ``` ] .right-plot[ 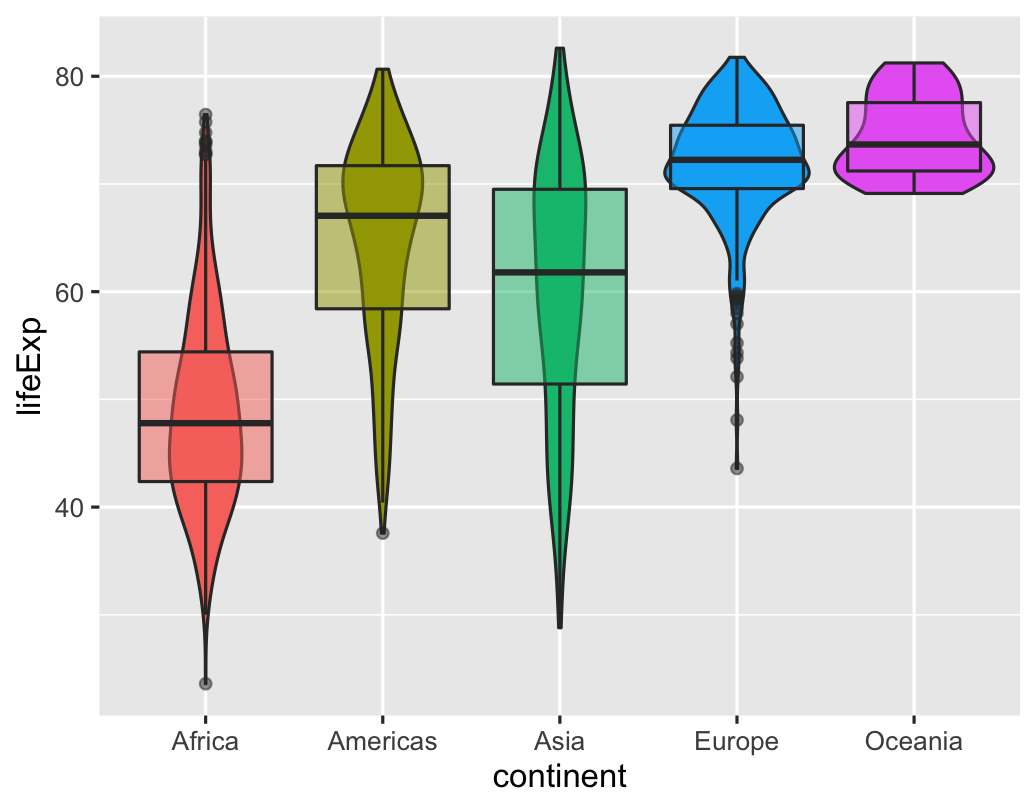 ] --- # Next up .box-inv-5.medium[Graphic design and ggplot themes]